55

To give a talk to 17-18 years old (who have a knack for mathematics) about how interesting mathematics (and more specifically pure mathematics) can be, I wanted to use nice facts accompanied by nice looking visualizations. However, the underlying mathematics should not be too trivial, otherwise it will not seem challenging to the students. I already looked into Chaos-Math and Dimensions-Math, which provided me with useful material, and I was wondering if anyone knows of similar things? I'm sure there have to be things in differential geometry, or topology, that are equally inviting!

Thanks!

VividD
  • 15,566
  • 8
  • 58
  • 114
Jan Keersmaekers
  • 1,046
  • 1
  • 8
  • 11
  • What do you mean be saying "...nice looking visualisations..."? Thanks. – Mikasa Sep 11 '13 at 08:15
  • 4
    fractals, may be one example which are both mathmatically challenging and visually attractive. – kaka Sep 11 '13 at 08:22
  • For example here you can find a nice visualisation of a horseshoe map and it's dynamics: http://www.chaos-math.org/en/chaos-vi-chaos-and-horseshoe – Jan Keersmaekers Sep 11 '13 at 08:26
  • The prime counting function can be expressed using among other things the zeroes of the zeta function. Here is a nice visualization of how the approximation gets better with increasing n: http://empslocal.ex.ac.uk/people/staff/mrwatkin/zeta/encoding2.htm – Daniel R Sep 11 '13 at 08:29
  • This might not be exactly what you're looking for, but Joseph Teran's [webpage](http://www.math.ucla.edu/~jteran/) has some cool videos showing results of his applied math / computer graphics research. – littleO Sep 11 '13 at 08:36

14 Answers14

45

I like $e^{i\pi}=-1$ for making people stop and go "What? Really?"

Besides the simple explanation "It's just $\cos(\theta) + i \sin(\theta)$" you can watch whichever definition of the exponential function you start with converge to the unit circle.

Definition 1: $\exp(z)=\sum_{i=0}^\infty \frac{z^i}{i!}$

sum definition

Definition 2: $\exp(z)=\lim_{n\rightarrow \infty} (1 + \frac{z}{n})^n$

lim definition

ssch
  • 373
  • 2
  • 6
Bobson
  • 113
  • 1
  • 7
  • 2
    @ssch - Thanks for some really nice graphics! – Bobson Sep 12 '13 at 13:07
  • @ssch What program did you use to produce that animation? – Keshav Srinivasan Sep 17 '13 at 22:02
  • @KeshavSrinivasan Mathematica, `ExpApprox[n_, x_] = Sum[x^k/k!, {k, 0, n}]; Manipulate[ ParametricPlot[{Re@#, Im@#} &@ExpApprox[n, I x], {x, 0, 2 Pi}, PlotRange -> {-2, 2}], {n, 1, 20}]` – ssch Sep 17 '13 at 23:39
  • A nice (and straightforward) problem for those with a little analysis background: prove that the 'tail end' of the first of these animations has infinite winding number around 1. – Steven Stadnicki Oct 07 '13 at 22:40
31

Here is a beautiful video about sphere eversion.

Here is a beautiful video about Möbius transformations.

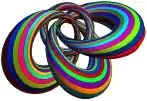
Here is a gallery of surfaces in differential/algebraic geometry. There are dozens of beautiful images here -- and there is so much to say about all of them. Examples:

enter image description here enter image description here enter image description here

Here are pictures of the Weierstrass function and of $f(z) = \text{exp}(1/z)$. The Weierstrass function is continuous but nowhere differentiable. The second function provides a visual example of Picard's Theorem in action. Both of these are pretty mind-blowing, I think.

enter image description here enter image description here

And lastly, here is a picture of the phenomenon of holonomy, which is a topic I'm considering researching. Notice that the north-pointing vector at $A$ is parallel transported in a loop, yet returns to point $A$ rotated.

enter image description here

azimut
  • 20,315
  • 10
  • 65
  • 122
Jesse Madnick
  • 29,652
  • 7
  • 90
  • 147
24

Whenever I hear "beautiful math", I immediately think fractals. A personal favorite of mine, for some time now, has been the Mandelbrot set.

Take a point on the complex plane: $(x,y) \to x + yi$. If you square this number $(x+yi)^2 = (x^2 - y^2) + 2xyi$, then square the result, and so on to infinity, one of three things will happen. If the magnitude of this complex number (straightline distance from the origin) is less than one, the value will asymptotically trend to zero. If the magnitude is more than one, it will trend to infinity. If the magnitude is exactly one, the value will either be unchanged, or it will move around to various other points that are of magnitude 1. This in itself can be used to draw some visually-interesting graphs. The set of all points for which the function does not diverge to infinity is the S-set, and its shape is the unit circle.

The Mandelbrot set adds a simple variation to the function; instead of just iteratively squaring, the value is squared, then the original value is added. The set of all points for which this function does not diverge is the M-set. Sounds easy, and it is, but the shape we get is, shall we say, more complex:

enter image description here

The shape of the M-set, in fact, has infinite detail given real coefficients of the complex numbers. The above image (and most other images of the Mandelbrot set) are colored, by using the number of iterations of squaring and adding needed to determine that the function diverges from that point (if the magnitude of the value ever exceeds 2 it will definitely diverge) to pick a color from a gradient or other palette (above, from dark blue to white).

Zoom in closer to any point on the edge of the set, and the M-set displays it true beauty:

enter image description here enter image description here enter image description here enter image description here enter image description here

"Pretty", I hear you say, "but how's it useful?" Well:

  • Notice the self-similarity in many of the images; in a few, you see the image of the full set reproduced at what ends up being a much smaller scale. The mathematical reasons behind this are the focus of study in data compression algorithms.
  • This same self-similarity is also being used by astrophysicists to explain aspects of our entire universe, such as why galaxies tend to form in similar, roughly rotationally-symmetrical shapes.
  • The points close to but not in the M-set do not diverge linearly away from the nearest edge. The path any one starting value takes through the complex plane on its way to infinity is, in many cases, just as interesting (from aesthetic and mathematical standpoints) as the full set. This path-tracing has been used to simulate light in complex reflective/refractive structures, like insect shells.
  • Portions of the M-set (and of the related Julia sets) have been used as topological maps to generate artificial terrain for movies and video games.
  • Another type of fractal, the Hilbert space-filling curve, is used in cell phones and other devices for their antennas (to place the desired total length of antenna conductor into as small an area as possible).
KeithS
  • 2,709
  • 1
  • 13
  • 22
21

These students have certainly covered trig. If they have also taken (or will soon take) calculus, then they may be interested to know that the power series for sine and cosine, and the ones for secant and tangent, have visually-interesting geometric interpretations.

Involute pinwheel for Sine and Cosine Involute zig-zag for Secant and Tangent

See my answer here and also the PDF accompanying my Bloog post, "The Geometry of the Power Series for Trig Functions". Perhaps someone in your audience will be inspired to find the corresponding figure for cosecant and cotangent, which has so far eluded me.

Speaking of trigonometry ... Here's a picture from another answer (and Bloog post) that almost counts as a proof without words for the derivatives of sine and cosine:

Derivatives of Sine and Cosine

Blue
  • 69,412
  • 11
  • 108
  • 217
17

What about Euler characteristic and, say, Poincaré-Hopf theorem?

enter image description here

Start wearing purple
  • 52,227
  • 12
  • 155
  • 218
9

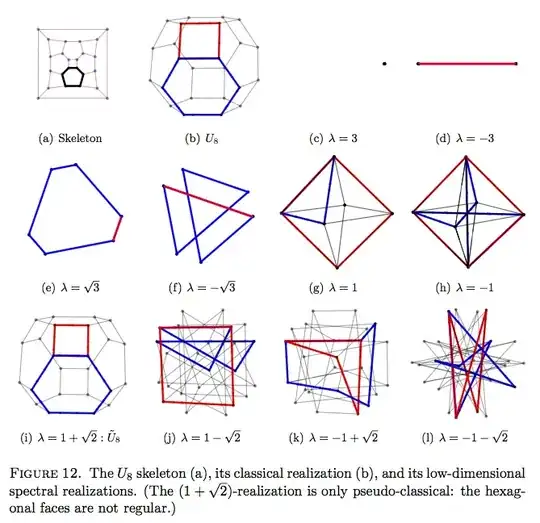
In this answer to a question about spectral graph theory, I mention that the eigen-decomposition of the adjacency matrix of a combinatorial graph leads to geometric realizations of the graph that are "harmonious" (automorphism are induced by isometries) as well as "eigenic" (beside the point here). For highly-symmetric graphs, the realizations can have great visual appeal.

I'll include the image from that answer here ...

Realizations of U8

... and I'll refer again to my Bloog post, "Spectral Realizations of Graphs", that links to my PDF notes documenting hundreds of examples.

Blue
  • 69,412
  • 11
  • 108
  • 217
9

My favorite visual proof is of Sperner's Lemma and the various fixed-point lemmas.

This shows the basic pictoral proof of Sperner's Lemma.

These notes show how to prove existence/oddness of Nash equilibria with a similar three-colored-triangle-and-arrows Sperner type argument (scroll down about halfway to get the relevant pictures).

In addition to Sperner's Lemma and Nash's Theorem, here are some other results that can be proved using an almost-identical pictoral argument: Brouwer Fixpoints, Kakutani Fixpoints, Tucker's Lemma, Borsuk-Ulam, Ham Sandwich Theorem.

I've got some old animated slides that I made for an old class project on a similar topic ("prove something cool using pictures"), where I pictorally derived each of these theorems from each other. Here's the link.

GMB
  • 4,016
  • 1
  • 17
  • 32
  • I would find them useful, though I am not the OP. Please share those old animated slides. Thank you – Isomorphism Sep 11 '13 at 09:10
  • Okay! I edited the link into the post. I made it for a computational geometry class, so the slides are technically about the PPAD complexity class (which houses the computational version of every one of the theorems I listed above). I hope the slides make sense without my narration :p – GMB Sep 11 '13 at 09:18
  • Oh, and you should definitely use the "present" button. If you thumb through them one at a time it will just look jumbled. – GMB Sep 11 '13 at 09:19
  • That first link seems to have jumped from UChicago to Stanford. Here's the fixed version: https://web.stanford.edu/~amwright/BFPT.pdf – Akiva Weinberger Aug 04 '17 at 18:19
9

A nice looking result is Poncelet's closure theorem. I prefer to state it this way:

Let $C_1$ and $C_2$ be two plane conics. Fix a point $P_1$ on $C_1$ which is not on $C_2$ and a tangent line $\ell_1$ to $C_2$ passing through $P_1$ which is not tangent to $C_1$. Let $P_2$ be the point of intersection of $\ell_1$ and $C_1$ other than $P_1$, and let $\ell_2$ be the tangent line to $C_2$ through $P_2$ other than $\ell_1$.

Let $P_3$ be the point of intersection of $\ell_2$ and $C_1$ other than $P_2$, let $\ell_3$ be the tangent line to $C_2$ through $P_3$ other than $\ell_2$, and so on. The figure consisting of the line segments between the points $P_k$ is called the Poncelet traverse with initial point $P_1$ and tangent line $\ell_1$.

Theorem. If one Poncelet traverse closes in $k$ steps, then every Poncelet traverse closes in $k$ steps.

This yields pictures such as this one:

Students should wonder how to prove this beautiful theorem. The algebro-geometric proof is very pretty and illuminating in my opinion. The idea of the proof is easy to explain, and the details are interesting to investigate. There's a sketch of the proof on the Wikipedia page. For my bachelor thesis I gave an explicit version of that proof. Beautiful theorems and proofs such as these are a great reason to study math.

Ricardo Buring
  • 5,668
  • 7
  • 29
  • 58
7

One nice thing to discuss is Legendre's proof of Euler's theorem for convex polyhedra.

You can motivate the discussion by calculcation $v-e+f$ for different polyhedra (tetrahedron, cube, etc.) and even explain what happens for a polyhedron with a "hole" through the middle. The proof itself is interesting, combinatorial, and largely elementary. I found a nice reference at http://www.math.csi.cuny.edu/abhijit/talks/euler_slides_wpu.pdf

Prahlad Vaidyanathan
  • 30,282
  • 1
  • 33
  • 73
7

Lissajous curves are much simpler and less impressive than the many wonderful suggestions in here, but they were something that impressed me at just about that age.

5

Understanding the symmetry groups behind many of M.C. Escher's prints is non-trivial and visually appealing. The visually appealing book The Symmetries of Things is a great source for relevant images, as well as the underlying mathematical ideas (though the explanations are often incomplete and in some cases incorrect).

Michael Joyce
  • 13,750
  • 2
  • 27
  • 46
4

There is a nice and non-trivial task, which can be easily visualized. Imagine a square, and a person need to go from left-bottom to right-top corner. He makes a step to the right, then step up, then step right again, etc. As smaller the steps, as more the path will be close to a straight line. But the interesting part is that for any number of steps the length of the path will be equal to 2, and the length of diagonal is sqrt(2)...

Dmitry
  • 1
  • 1
  • 3
    The common terms for this are Taxicab geometry or Manhattan distance: https://en.wikipedia.org/wiki/Taxicab_geometry – Darrel Hoffman Sep 11 '13 at 14:00
  • Thanks for the term! English is not my native language, so I didn't know how to call it :) – Dmitry Sep 11 '13 at 22:12
  • It's obscure enough that even for a native English speaker it's not likely to be common knowledge. I just remembered seeing an article about this and thought it would be a useful addition. – Darrel Hoffman Sep 12 '13 at 15:01
3

I ran across What do numbers look like? enter image description here

This is the first million integers, represented as binary vectors indicating their prime factors, and laid out using the UMAP dimensionality reduction algorithm by Leland Mcinnes. Each integer is represented in a high-dimensional space, and gets squished down to 2D so that numbers with similar prime factorisations are closer together than those with dissimilar factorisations.

Keith McClary
  • 1,330
  • 1
  • 8
  • 14
1

Two of the things that have always captivated me are the Fibonacci Sequence and the Golden Ratio. It was wonderful learning how these ideas occur in nature to produce beautiful things. Have a look at this amazing video Nature by Numbers.

chowching
  • 745
  • 6
  • 20